3. Effect of Flow Rate
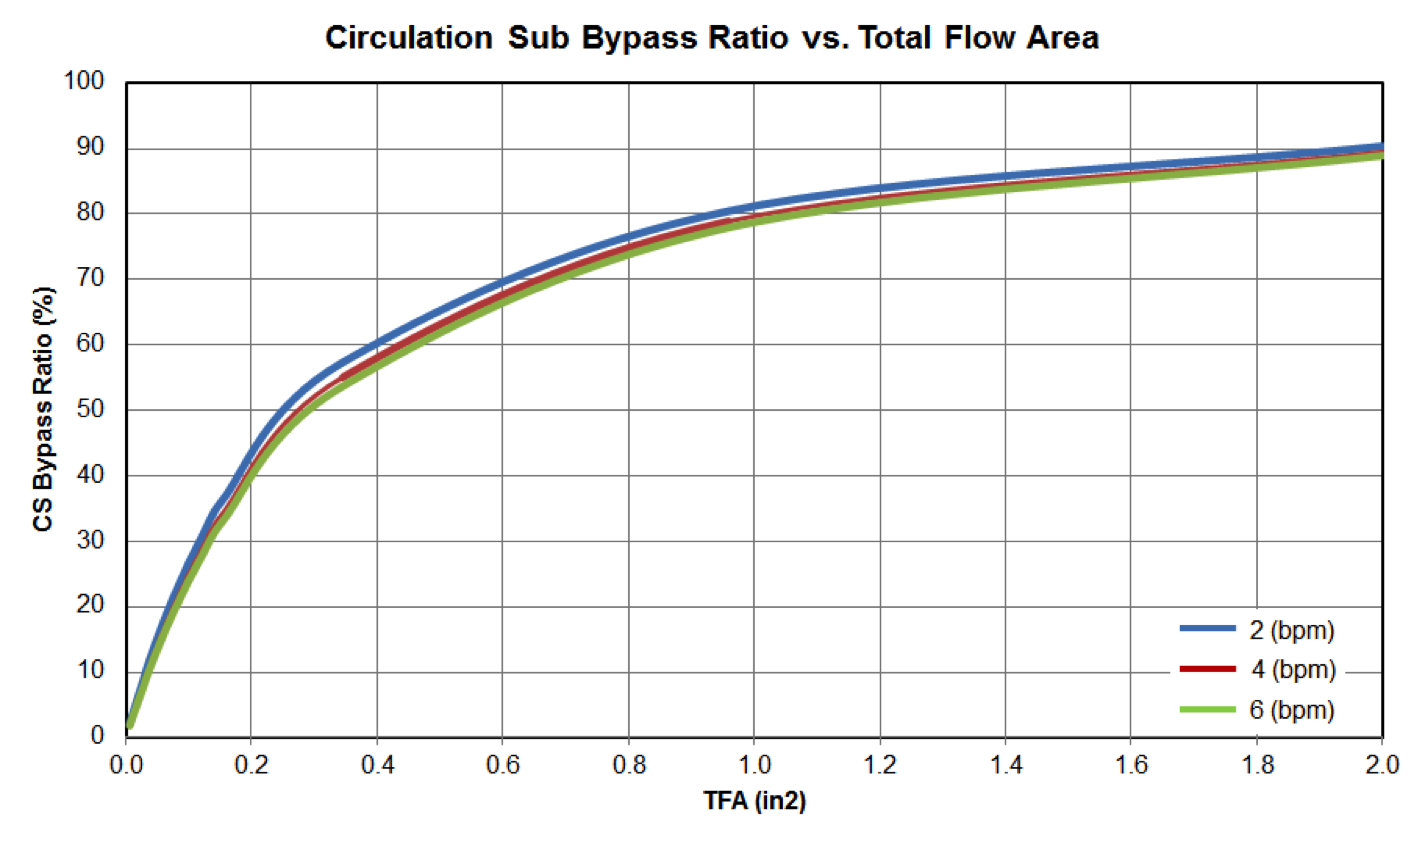
To study the sensitivity of flow rate on a circulation sub’s performance, 3 cases were chosen: one is without a circulation sub, and the other two have 1 (in2) and 2 (in2) of TFA, respectively. As we increase the flow rate from 1 to 10 (bpm), bypass ratios for both cases decrease. One might wonder why the bypass ratio decreases as flow rate increases. Does not the circulation sub play a bigger role in tougher conditions such as a high flow rate situation? Here is the reason behind the reverse change: the pressure drop across circulation sub nozzles (Path B) is proportional to the square of the flow rate, regardless of the rheological model. The frictional pressure loss along Path A is proportional to the flow rate to the power of 1.75 for Newtonian fluids in turbulent flow conditions. When the flow rate increases, it is relatively easier for fluid to flow along Path A than Path B. Therefore, at higher flow rates, the bypass ratio is smaller.
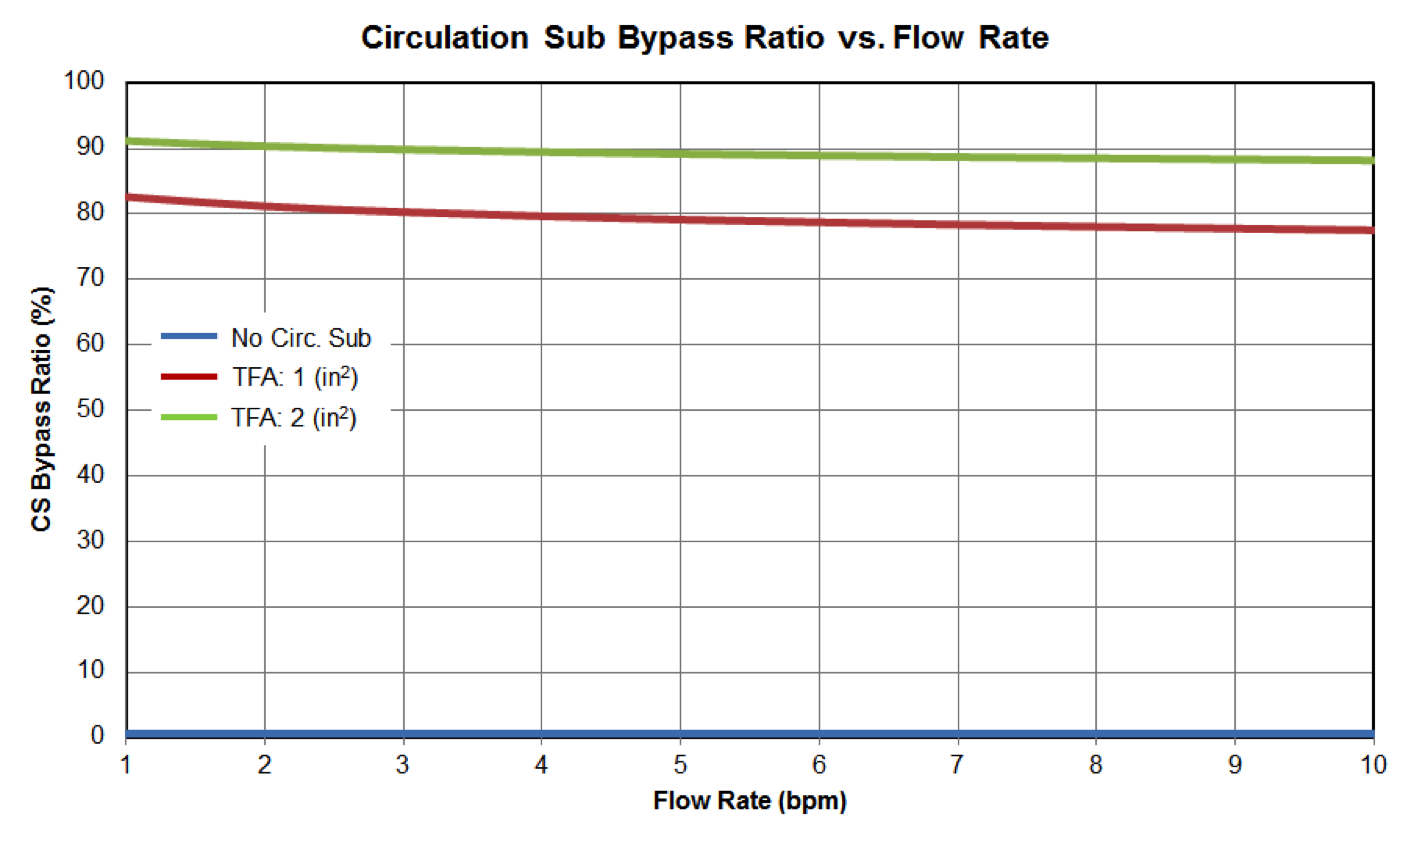
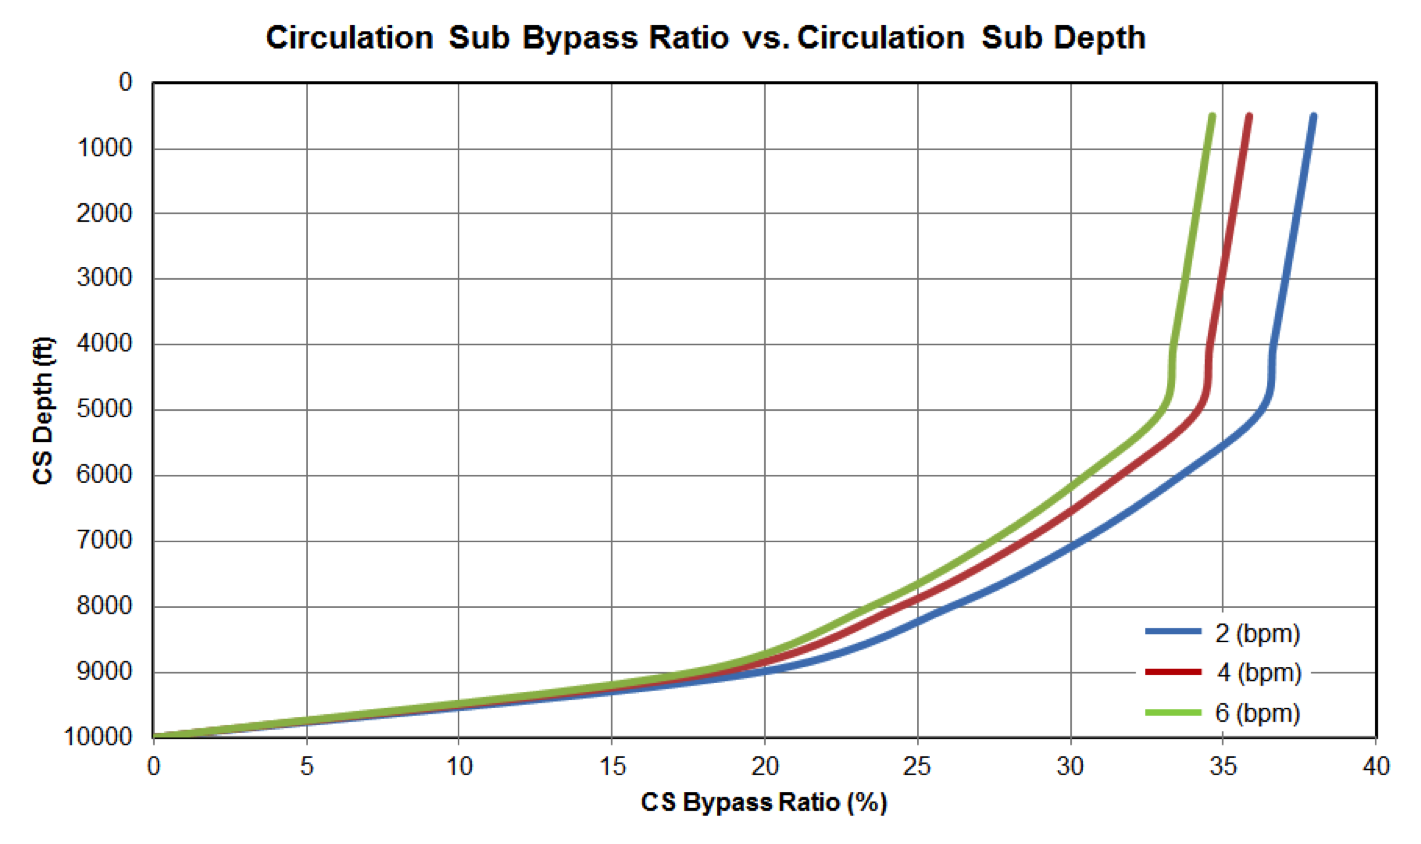
Figure 10: Circulation Sub Bypass Ratio vs Flow Rate
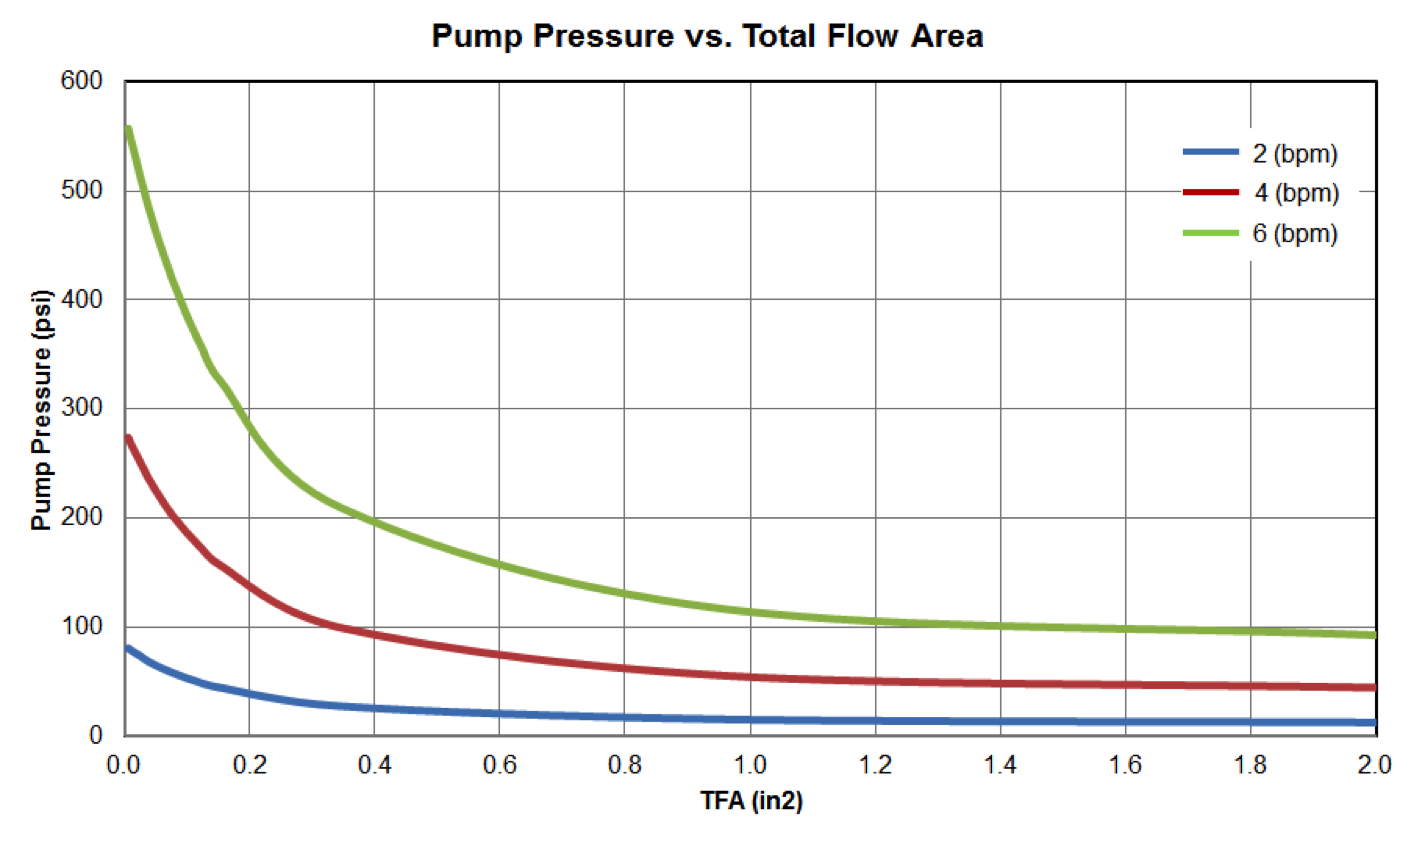
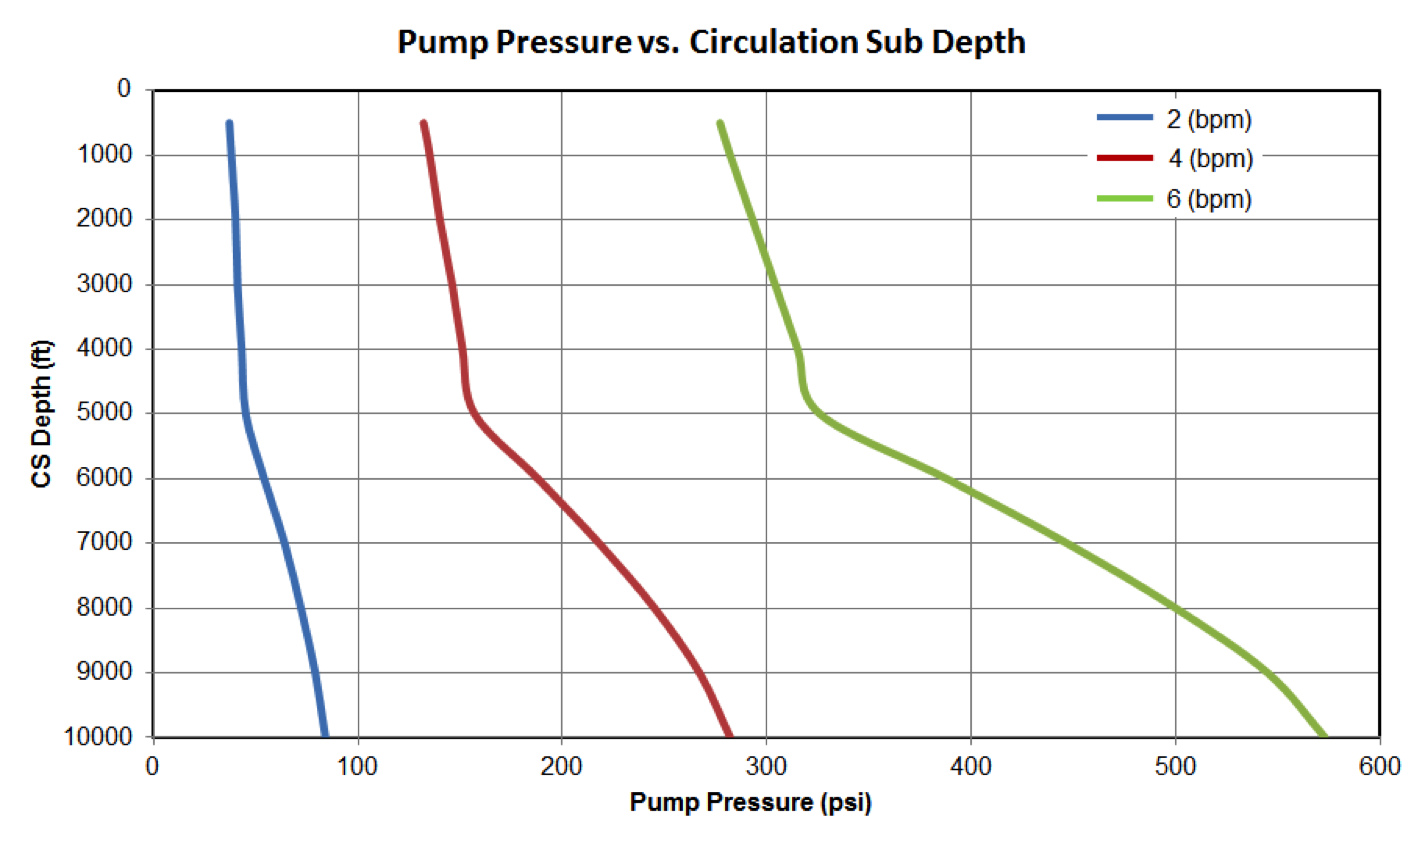
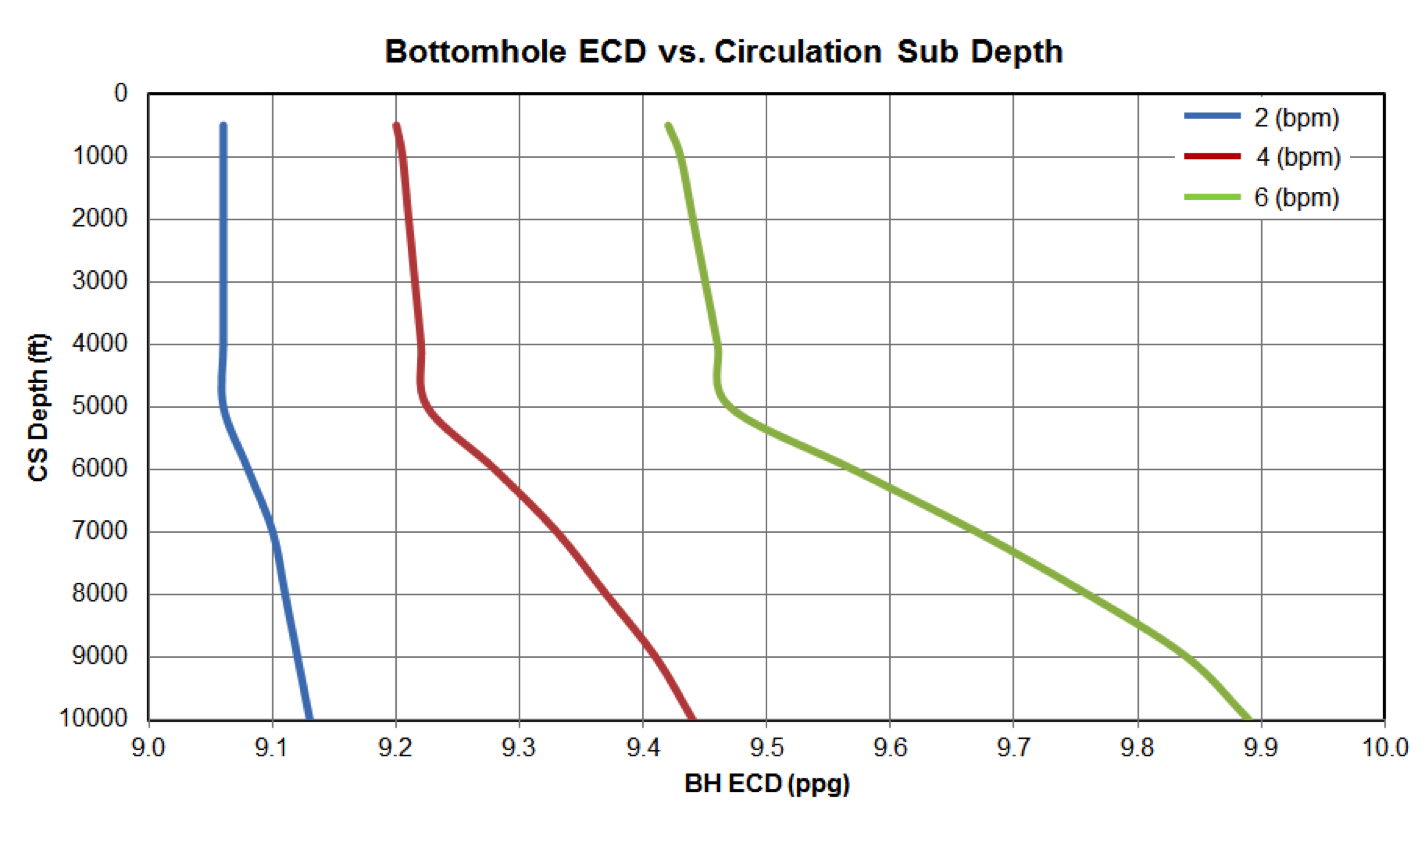
However, even with the slightly decreased bypass ratio at higher flow rate, the presence of a circulation sub greatly reduces pump pressure and bottom hole ECDs, as illustrated in Figure 11 and Figure 12. The benefits become more pronounced at higher flow rates. As noted before, the inclusion of a circulating sub makes a dramatic impact up to a certain TFA, in this case 1 square inch.
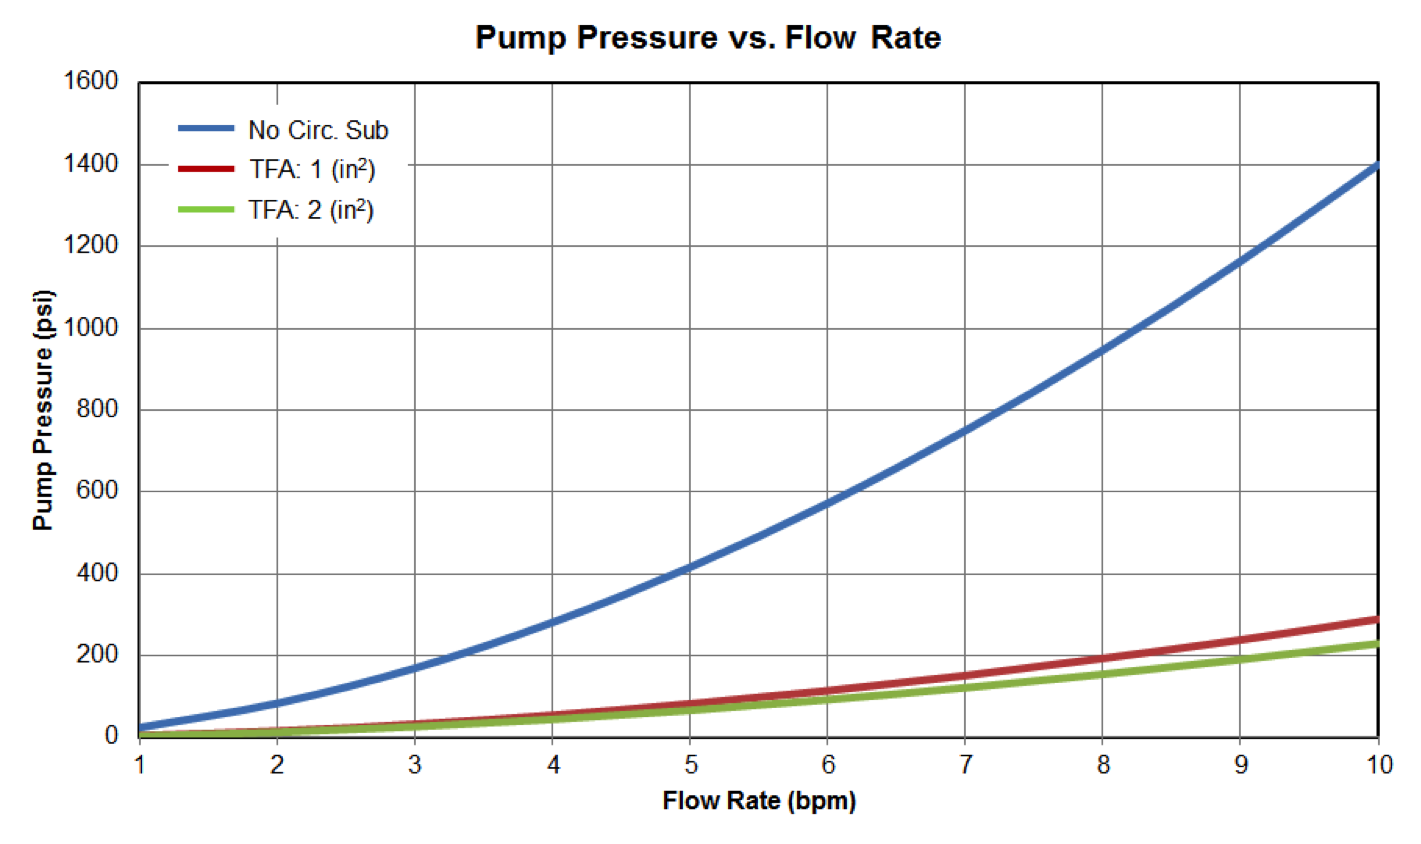
Figure 11: Pump Pressure vs Flow Rate
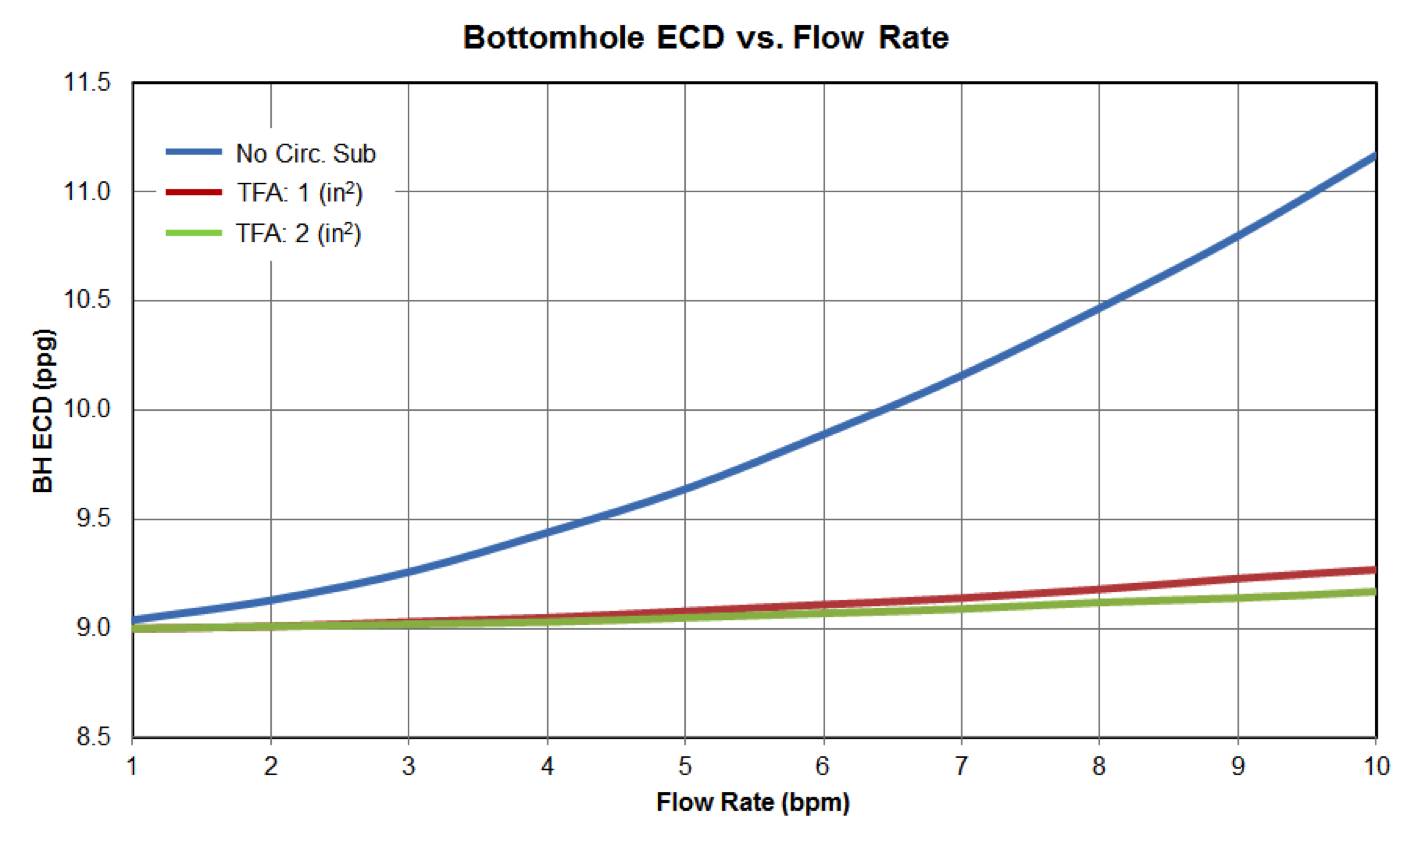
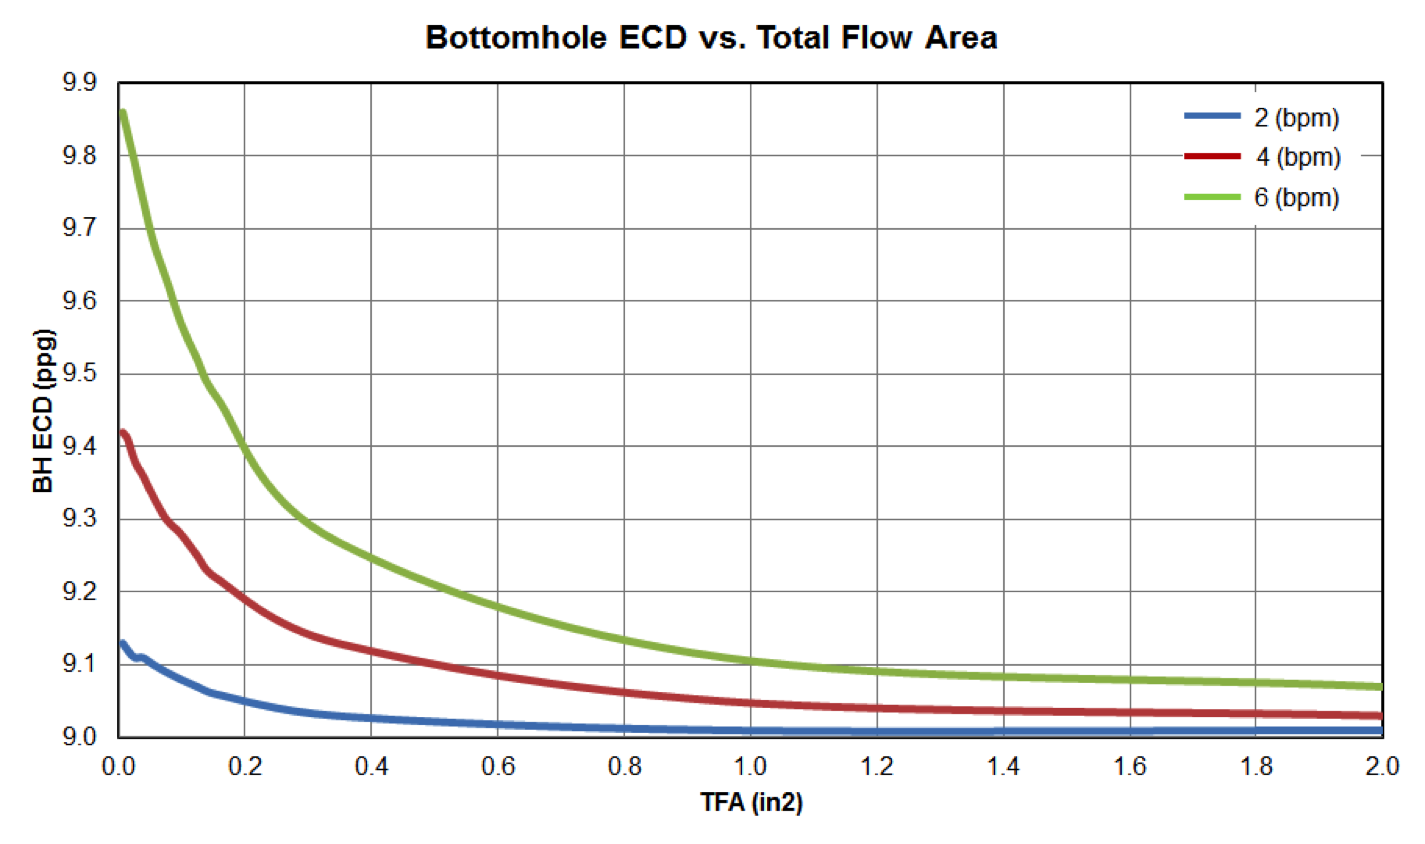
Figure 12: Bottom Hole ECD vs Flow Rate
4. Effect of Viscosity
Since viscosity has a small impact on the analysis, the circulation sub’s nozzles have been changed to 2 x 10 (1/32in) for this portion of the analysis, which yields a TFA of 0.153 (in2) for our base case.
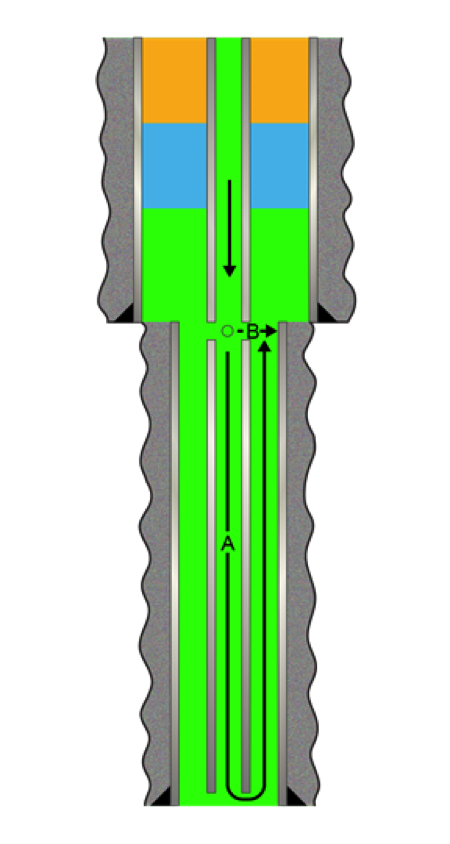
The flow split at a circulation sub is the result of flowing fluid seeking the path of least resistance and pressure balance. The frictional pressure loss along Path A is a function of fluid viscosity, density, flow rate and flow path geometry. If the flow is laminar, the pressure loss is proportional to the fluid viscosity for Newtonian fluid. The resistance of path B is dominated by the pressure drop across nozzles, where the viscous frictional effects are essentially negligible. As fluid viscosity increases, it is more difficult for fluid to flow through Path A. The bypass ratio will increase as illustrated by Figure 13. Both pump pressure and bottom hole ECD increase as fluid viscosity becomes higher. However, they would be much higher if no circulation sub is present.
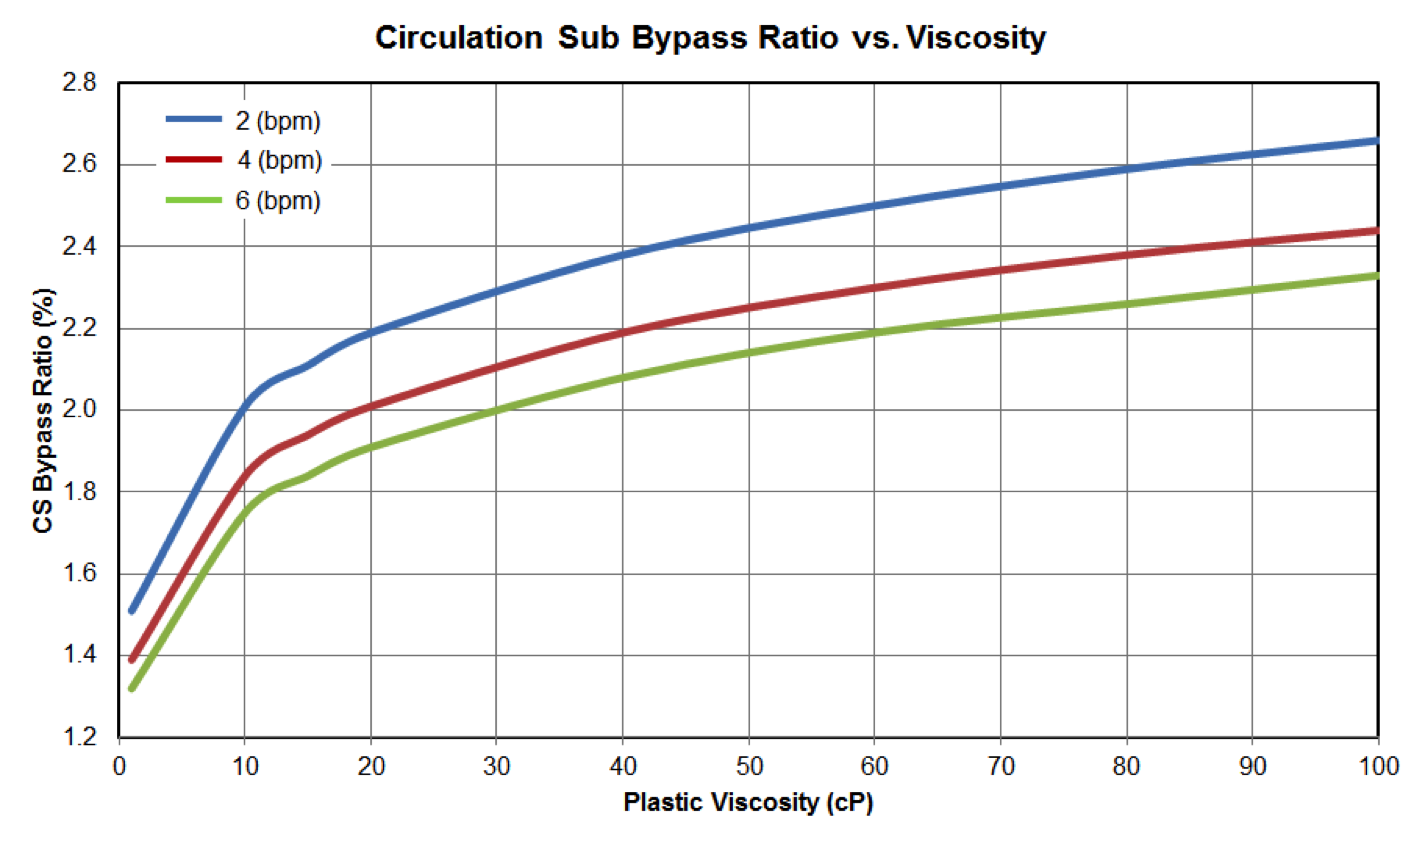
Figure 13: Circulation Sub Bypass Ratio vs Fluid Viscosity
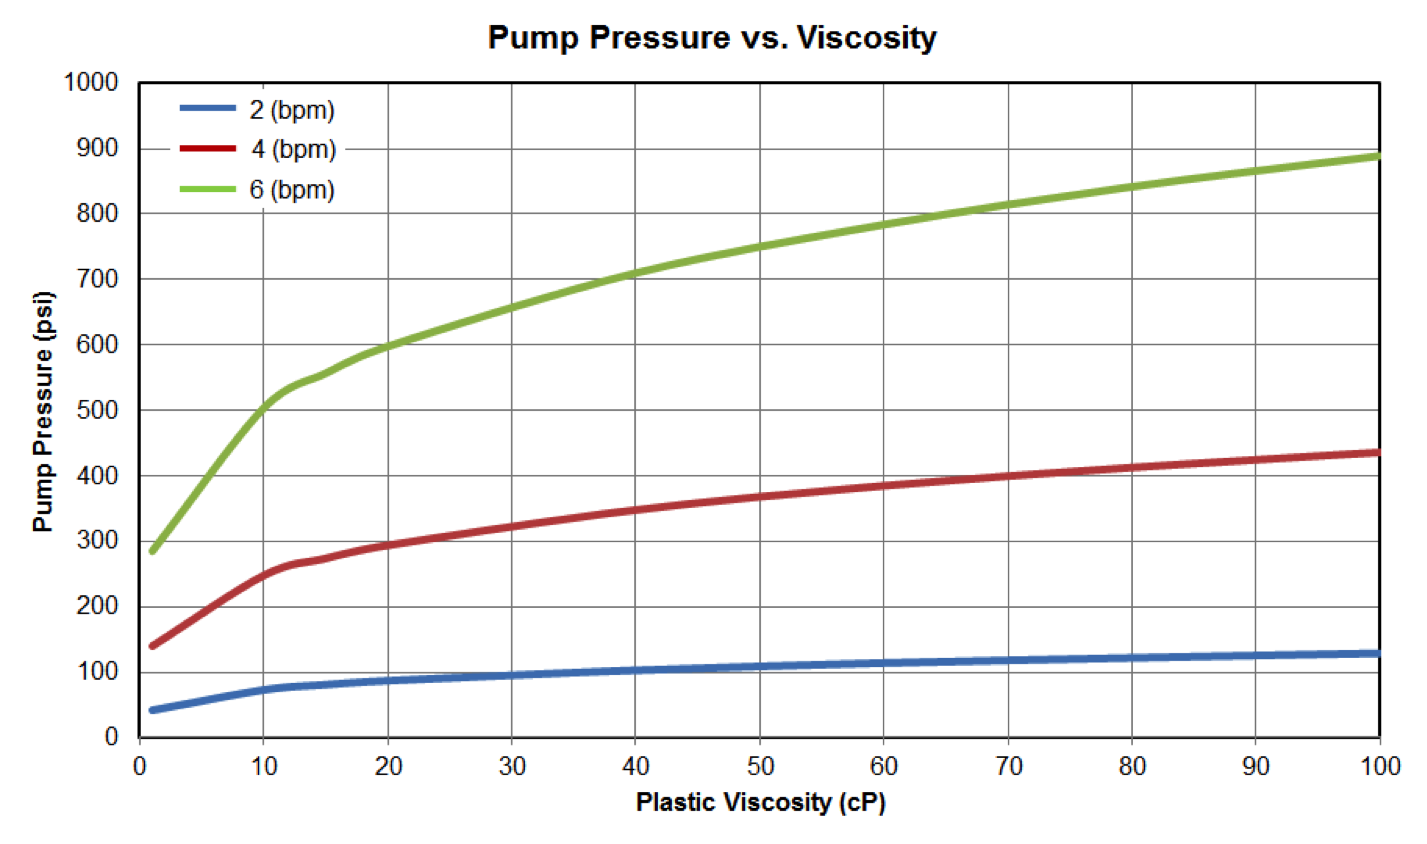
Figure 14: Pump Pressure vs Fluid Viscosity
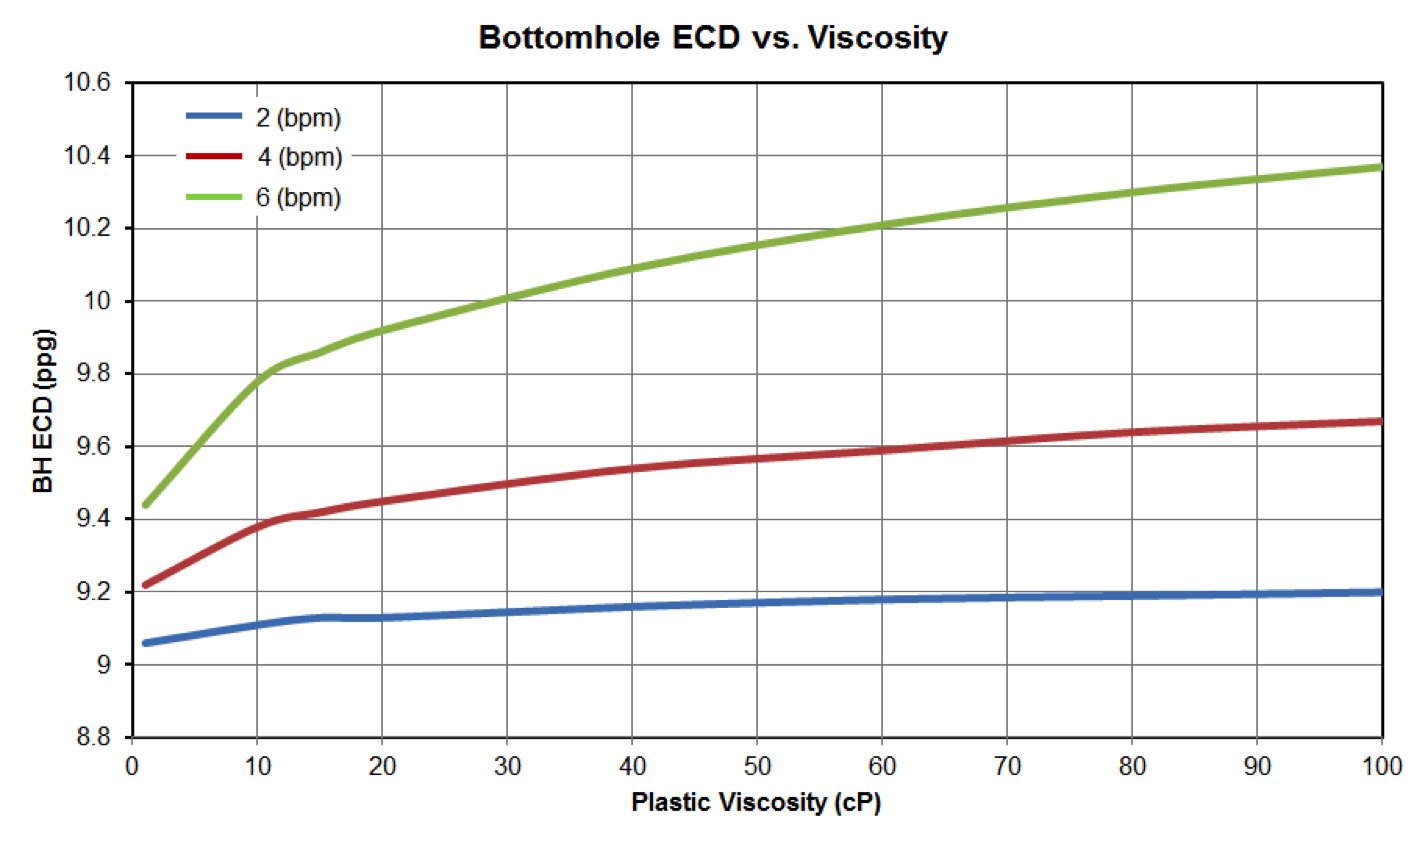
Figure 15: Bottom Hole ECD vs Fluid Viscosity
5. Effect of Fluid Density
If the flow is turbulent, the pressure loss along Path A is proportional to the fluid density to the power of 0.75 for a Bingham plastic fluid. On the other hand, the pressure drop across Path B is proportional to the fluid density. As the fluid density increases, it is relatively more difficult for fluid to flow through Path B. The bypass ratio will decrease when fluid density increases as illustrated by Figure 16. The pump pressure increases as fluid density increases. The bottom hole ECD increases because both hydrostatic pressures and frictional pressure loses increase with greater fluid density.
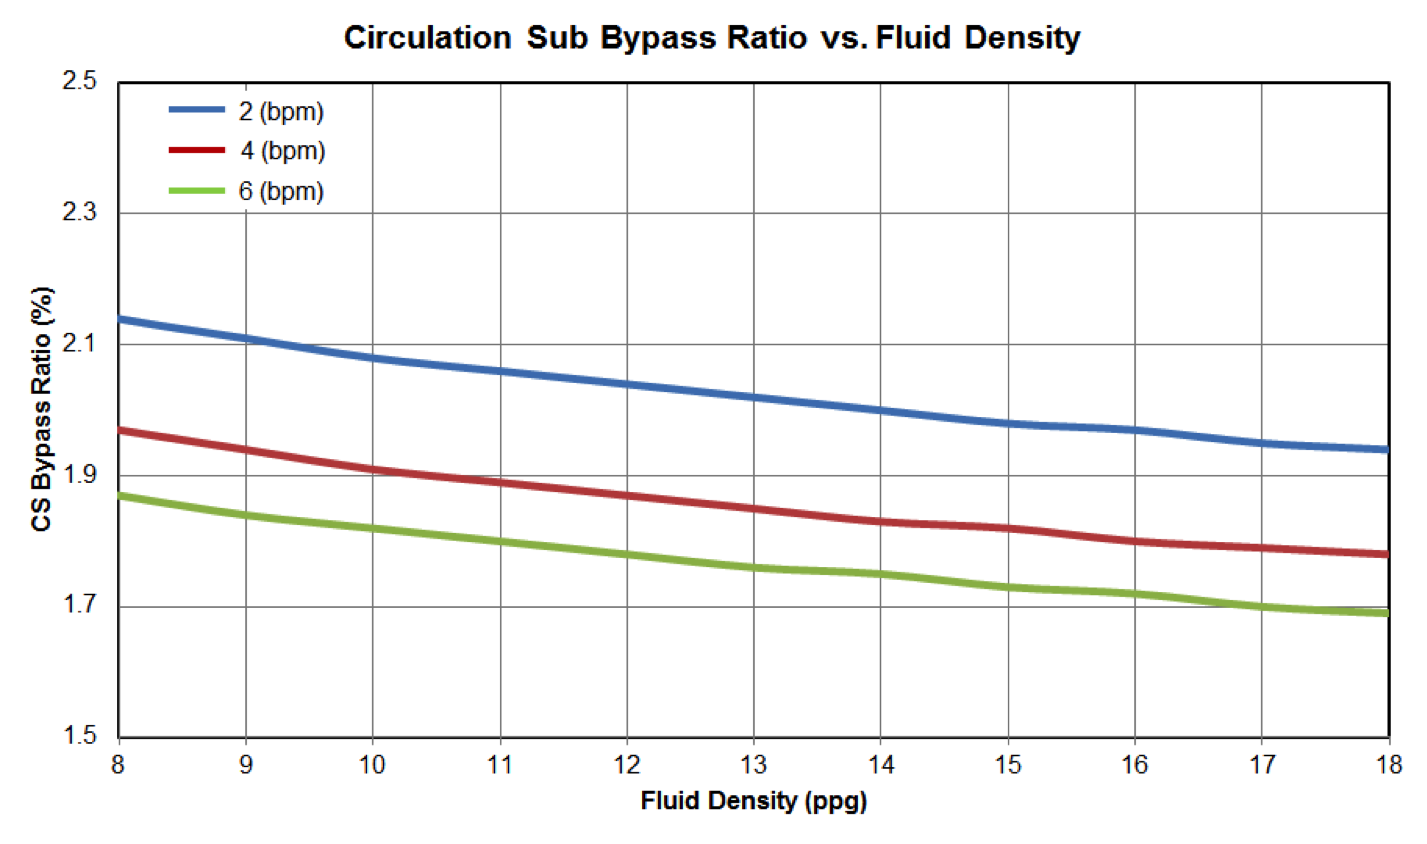
Figure 16: Circulation Sub Bypass Ratio vs Fluid Density
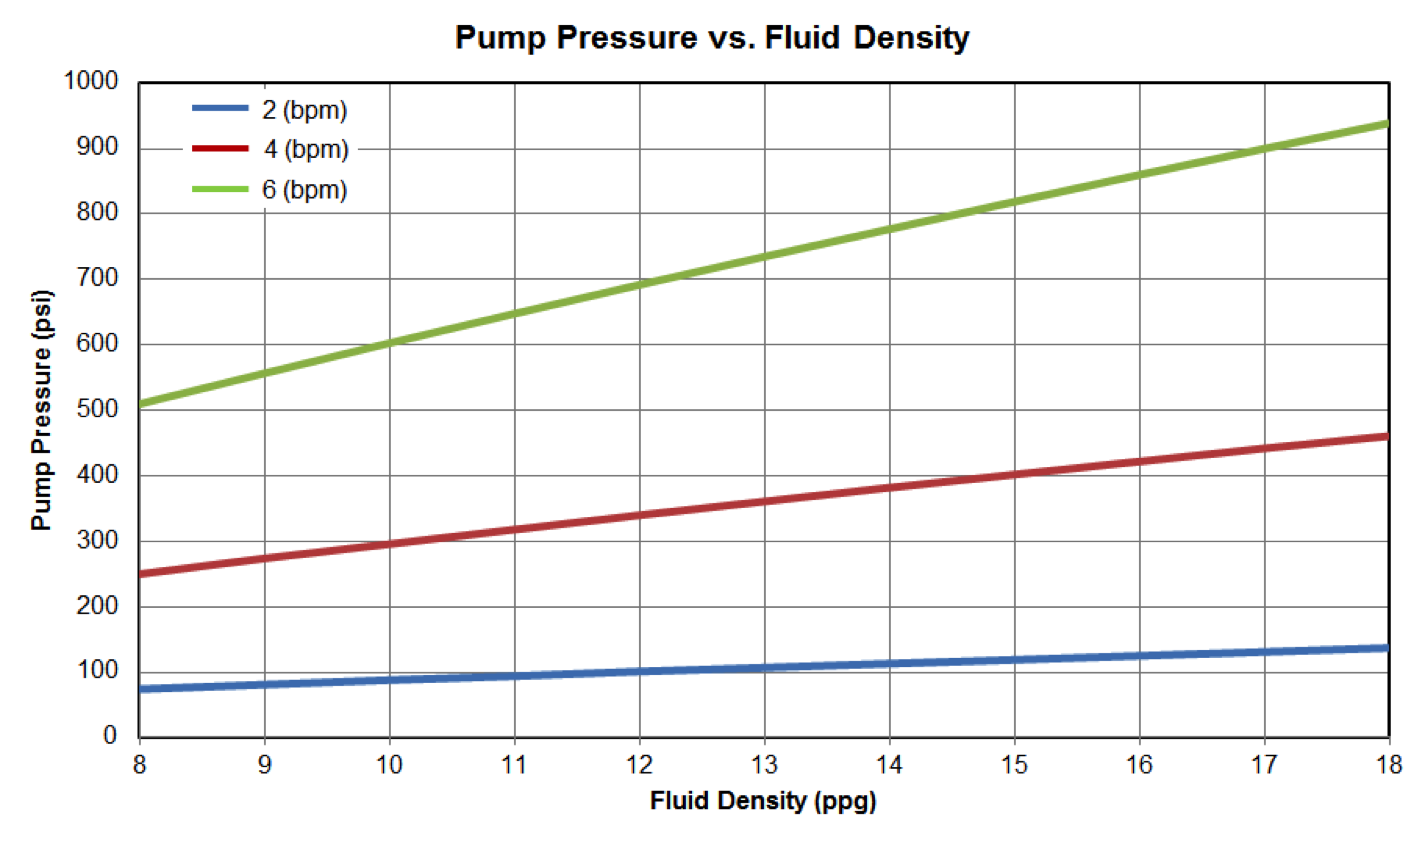
Figure 17: Pump Pressure vs Fluid Density
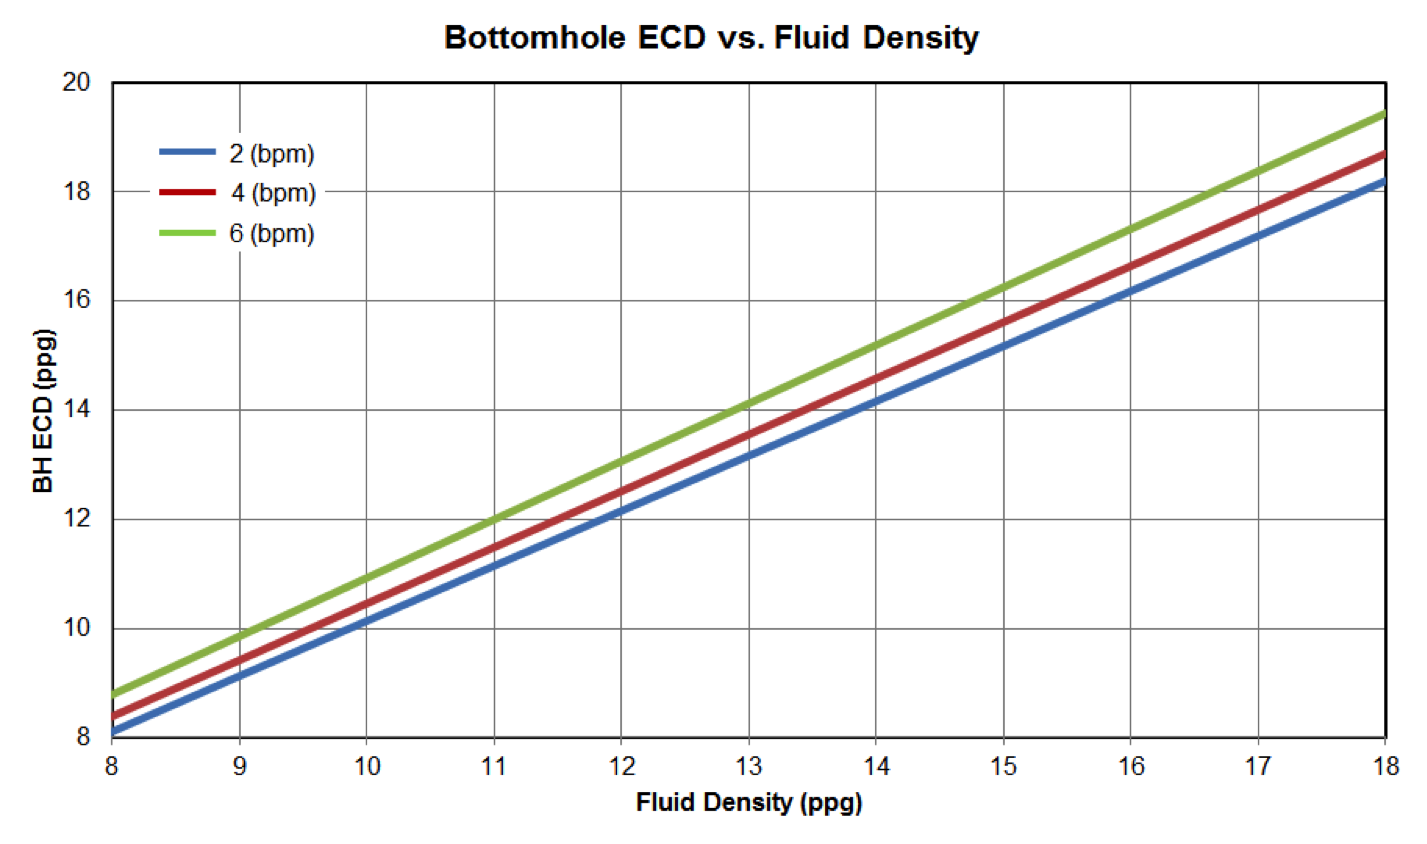
Figure 18: Bottom Hole ECD vs Fluid Density
The above case study is performed for a particular wellbore cleanup scenario. In order to have a better understanding of your particular case, it is recommended to use engineering software to take into account of well configurations and fluid properties to optimize circulation sub performance.